T °Pixel
T°Pixel® processes
Now, with
The intuitive workflow of
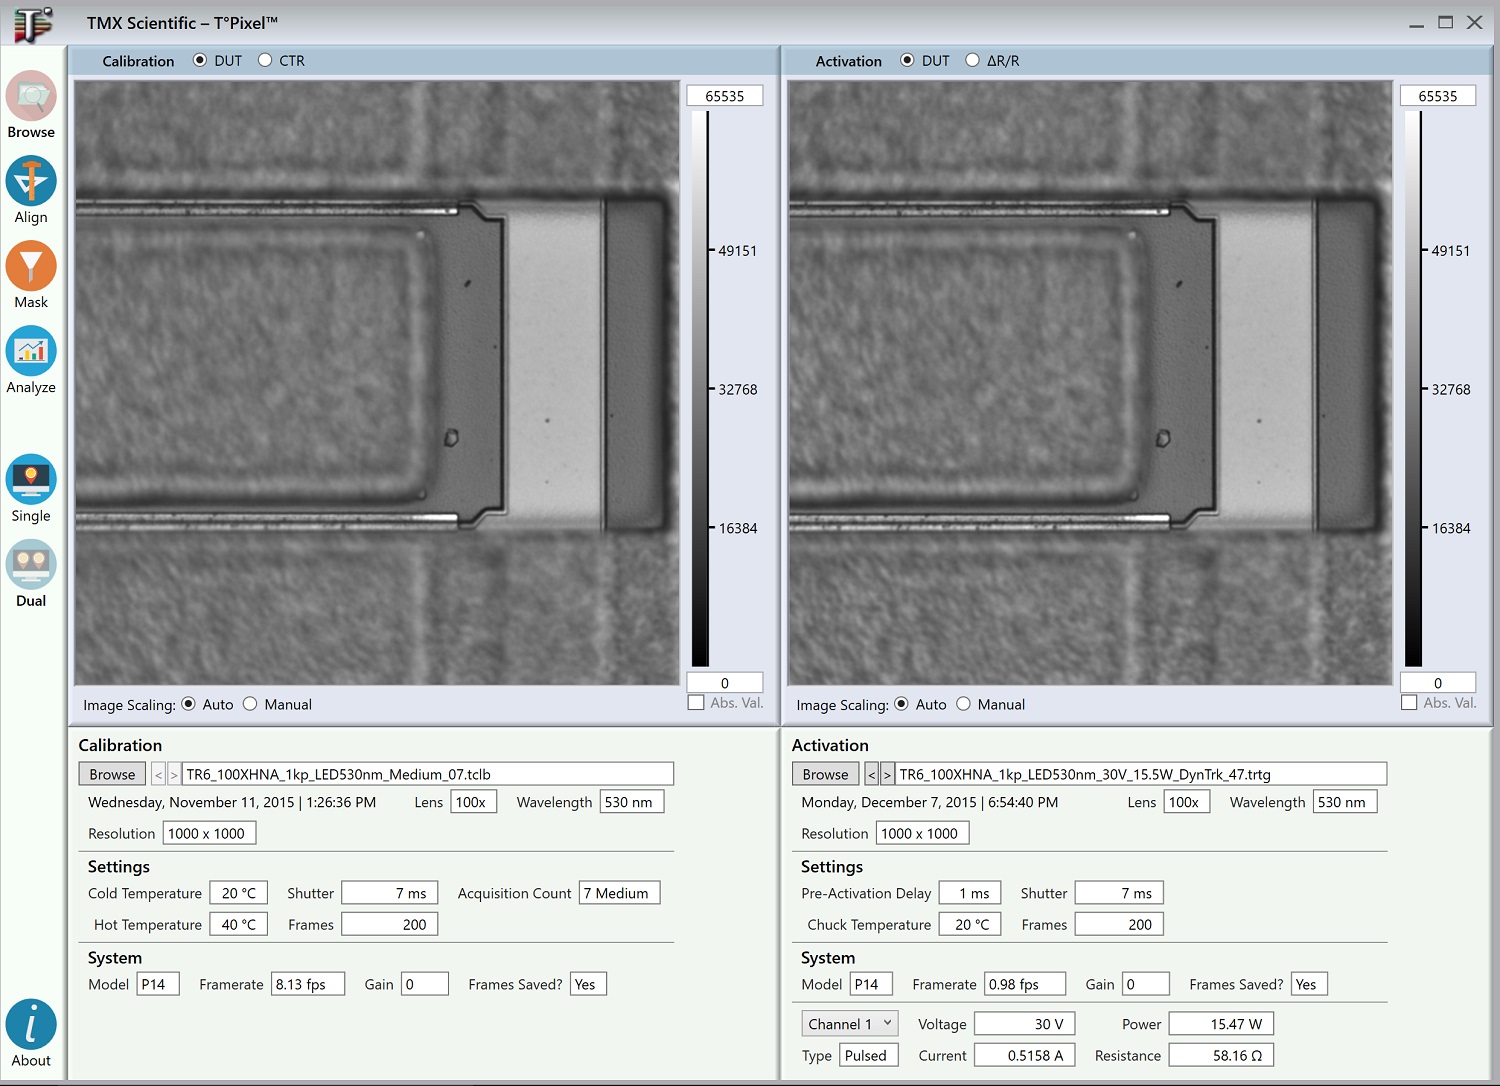
- Browsing – The user can browse through measurement files for both activation and calibration. The software provides a summary of measurement information, including date and time, lens type, light wavelength, and pixel resolution, as well as voltage, current, and power for each activation channel.
- Alignment –
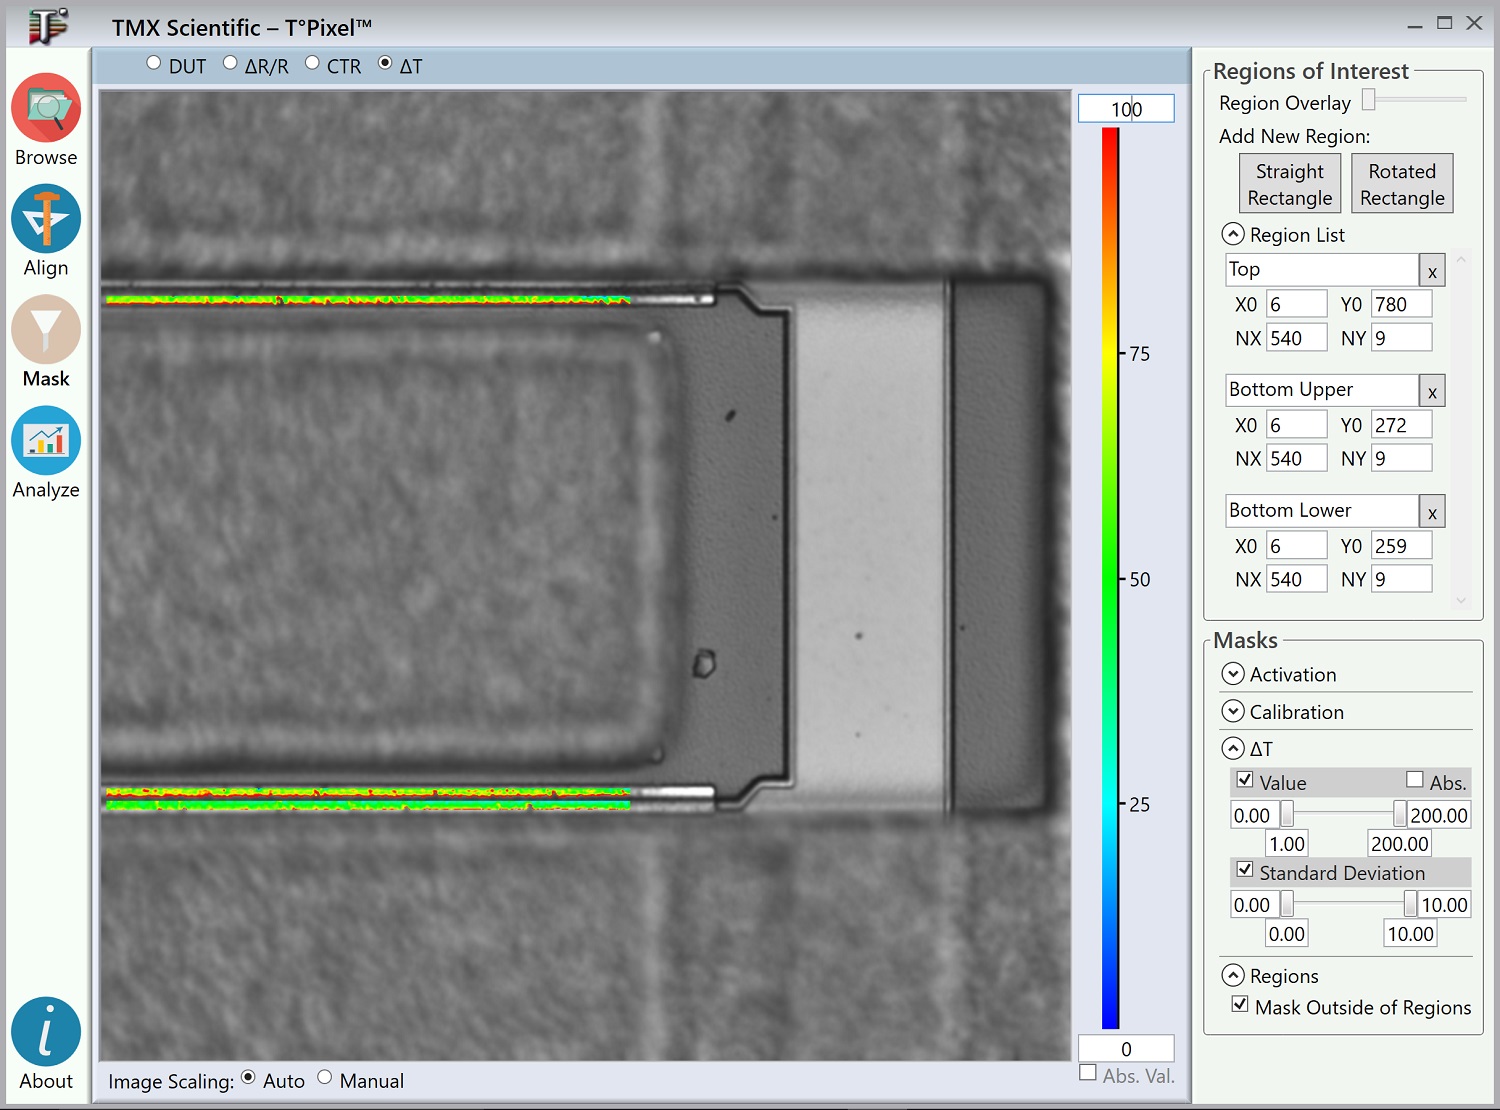
T°Pixel automatically aligns the acquired fields of activation and calibration in the x, y, and θ directions. In addition, intra-measurement alignment routines utilize measurement frame data to provide a pixel-perfect temperature field. - Masking – Statistics-driven masking removes pixels with weak signal-to-noise ratios. Available masking criteria include the standard deviation of the temperature delta field. Furthermore, user-defined regions of interest can be selected for individual examination and comparison.
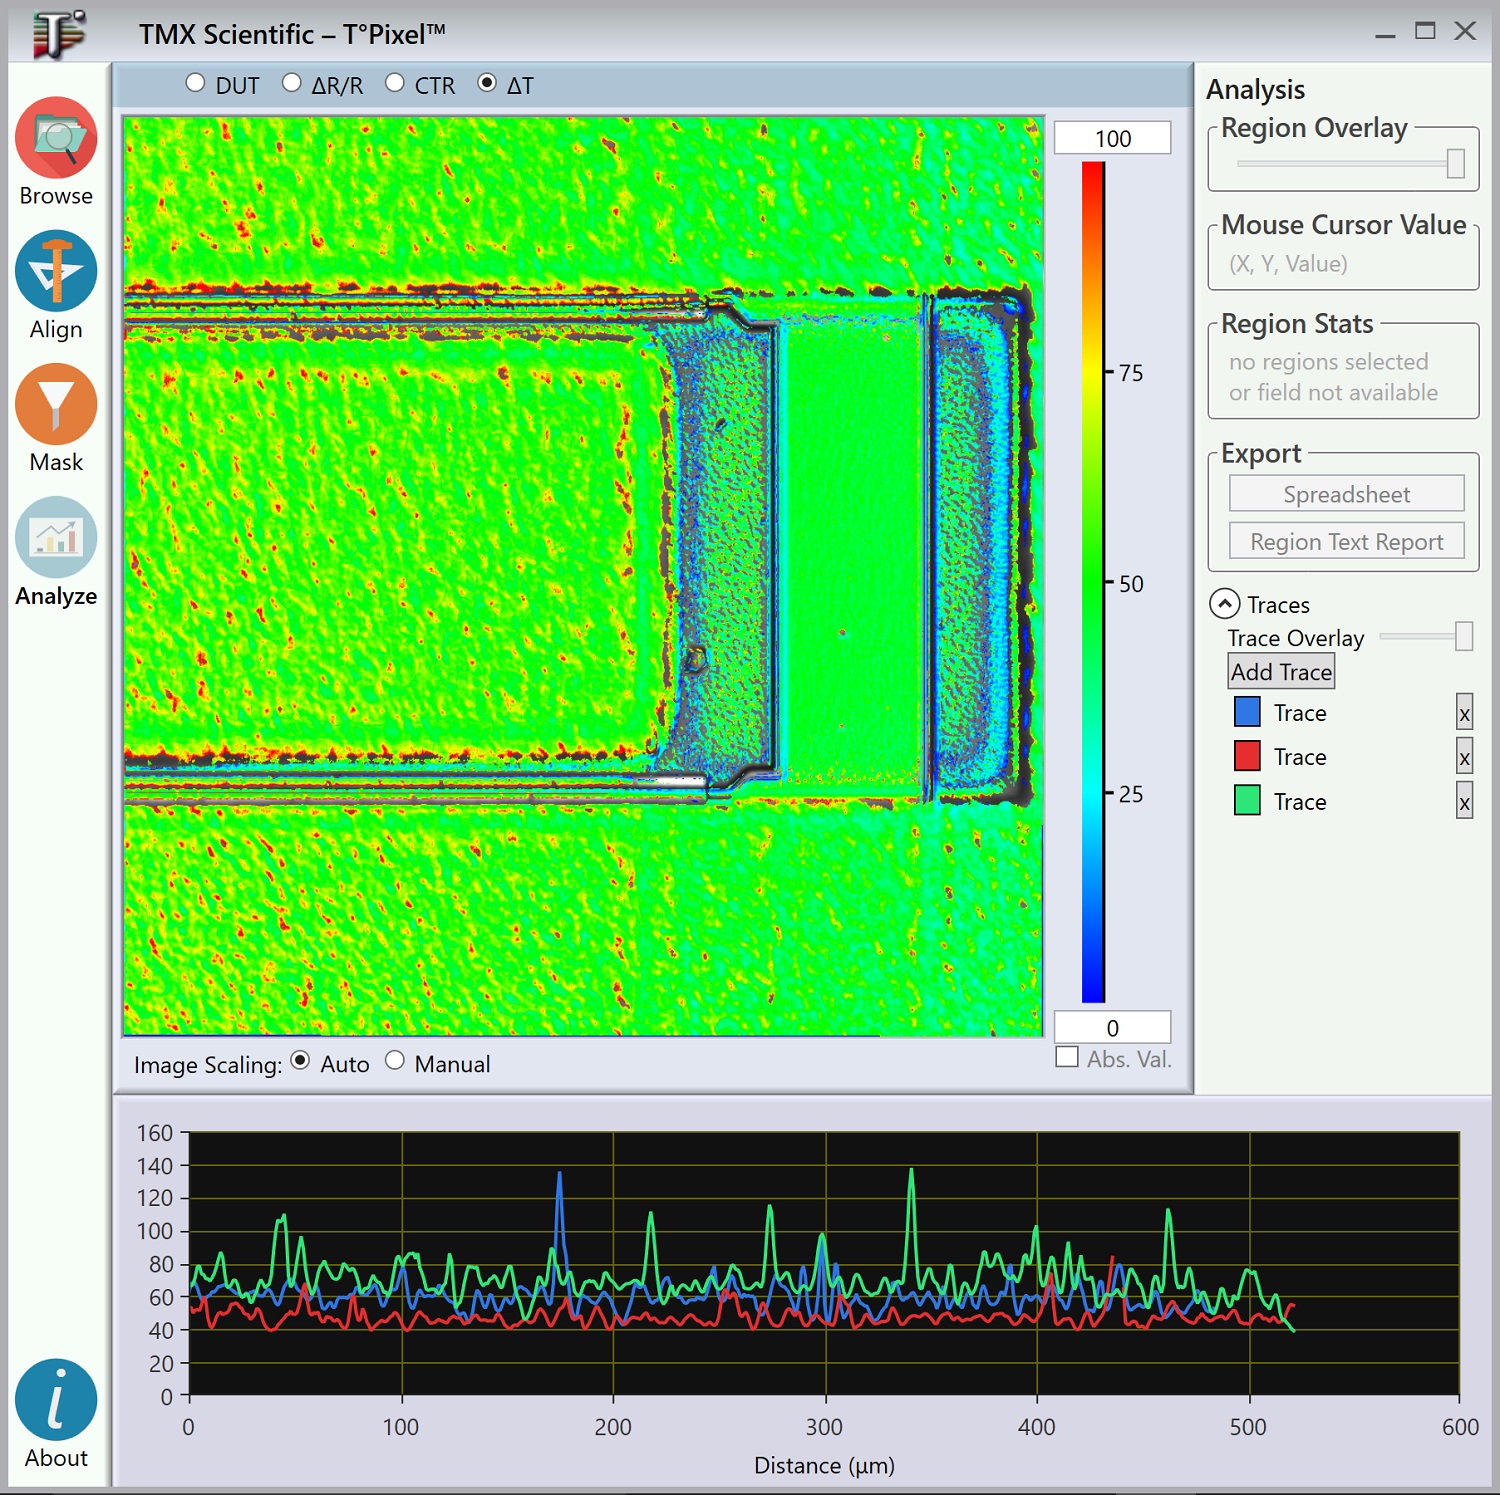
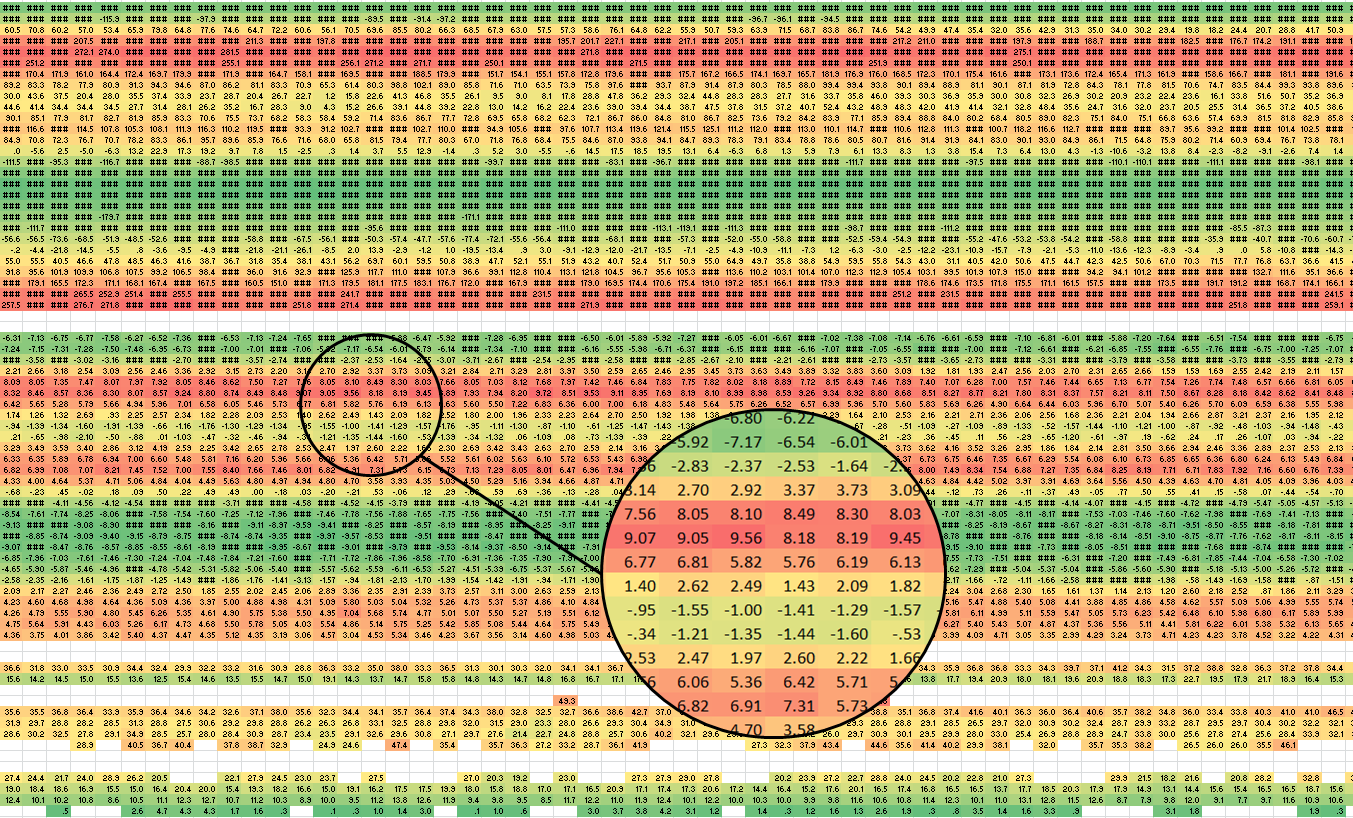
- Analysis – The final step displays region value statistics and enables spreadsheet exporting of per-pixel values.